One of the unused datasets from the Cities article was on average taxable income per capita across the 23 wards between 1985 and 2022 (kindly provided by the authors of this great article).
For the period I worked on for my PhD (1950/55-1975), this data was not available so I had to look at proxy indicators, primarily living space per capita. This came with its own limitations but provided opportunities to transcend a purely economic measurement of living standards.
My analysis found a compression in inter-ward inequalities between the 1950s and 1970s. What happened since then?
Most recent analyses on inter-ward inequality have noted a growing rift between the central business wards (Chuo, Chiyoda and Minato) and the rest, in line with the narrative of the neoliberal turn around the 1980s. Of note are Jacobs (2012) and Hashimoto (2021). Both used a coefficient of variation as their analytical tool.
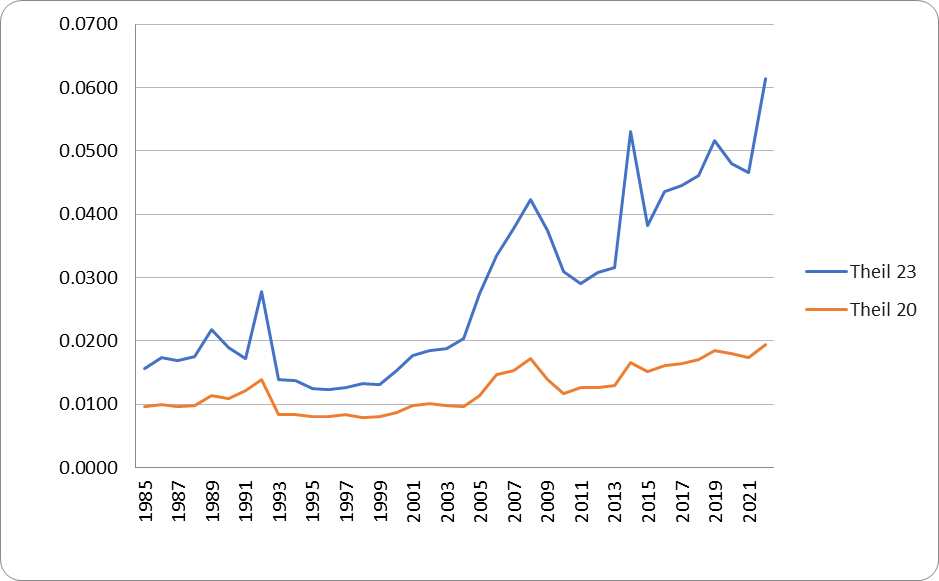
I calculated Theil indices with this dataset and corroborate their findings: the differences between two Theil sets (23 wards as a whole and another set without the three richest wards as of 2022) are significant. In my analysis, however, I swap Chuo with Shibuya, which is the ward with the third highest taxable income.
It’s remarkable that without Minato, Shibuya and Chiyoda, the inequalities between the remaining 20 wards have remained remarkably small.
Urban inequality in Tokyo exists at three levels: inter-ward (rich wards pulling away from the poor wards as shown above), intra-ward (affluence increasingly concentrated within traditionally wealthy chome, or those that are undergoing redevelopment) and intra-chome (due to the construction of residential developments directly adjacent to older, and often poorer housing).
Taxable income per capita data is not (easily) available at the chome level so we continue to rely on proximations. The best example I could find on Tokyo is Kidokoro et al 2023 (linked above), who plug ten chome-level indicators ranging from fire hazard rating to educational attainment into a principal component analysis, showing significant intra-ward stratification.
If income data existed at a more granular level, it would be great to get access to the raw census data to look inside the chome and do some statistical analysis here, e.g., the discrepancy between the median and the mean taxable income per capita. It will probably corroborate the insights of Kidokoro et al.
For now, qualitative analysis (e.g., morphology mapping, as done in our paper) remains one of the only ways to capture economic inequalities at a micro scale. In order to enrich a political debate about these redevelopments, however, better data is needed to really drive home their disruptive influence on the fragile Tokyo model of urban development.
