What happens to urban equity when a city grows extremely fast? Next up in the urban inequality series is a post on Tokyo’s historical housing inequalities that aims to shed some light at the following questions: Over time, how much living space did the average inhabitant of Japan/Tokyo have and what was the corresponding homeownership ratio? Were there big differences between the 23 wards?
Some contours of housing in Tokyo vs. Japan, source
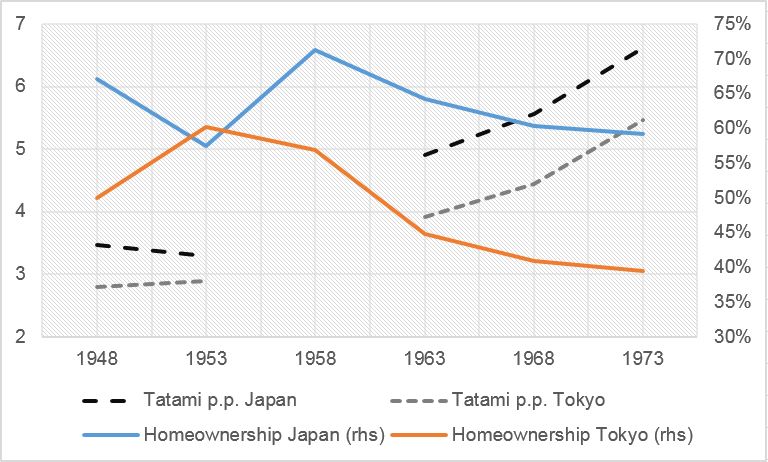
To begin with, I want to place Tokyo in the context of Japan as a whole. Above is a graph that shows how Tokyo compares in terms of homeownership and floor space per person from 1948 to 1973, roughly my period of observation. The story is quite quite clear: There is a trend towards more living space per person, as well as a structural decline in homeownership.
Tokyo has less living space per capita than Japan, which shouldn’t surprise us given that prices in the capital city are bound to be higher due to more demand as well as space constraints. Lower home ownership can also largely be explained by higher prices of real estate in Tokyo compared to the rest of the country, to which one could add a litany of other socio-economic explanations.
Besides these rather obvious differences, there is in my mind one really interesting message in this chart, i.e how Tokyo and nationwide home ownership moved out of sync for the early postwar period: Home ownership rose in the immediate postwar period in Tokyo, while it declined nationwide. Tokyo actually exceeded national homeownership in one year, i.e. 1953. From here, it declined in the capital while it increased in Japan as a whole, until the late 1950s, when homeownership declined universally.
This initial trend is mirrored in (slightly) decreasing tatami mats per person in Japan as a whole as opposed to more space per capita in Japan in the 1948-1953 period. A housing survey from 1949 gives some hint as to why the homeownership ratio in Tokyo might have increased in this period. (Which leaves the question why it decreased nationwide unresolved for now. But first things first.)
In 1949, about 64% of Tokyo’s housing stock was prewar. Just under 5% had been built during the war, with the remainder 32% built between 1945-1949. The fact that a good third of the city’s houses were built in the span of just four years shows the tremendous destruction wrought upon the Japanese capital by Allied bombs.
Of the rebuilt housing stock almost three quarters was rebuilt by the owner, with 20% rebuilt as rented accommodation and 6% as company housing (as opposed to an almost 50/50 split for all houses — prewar, war and postwar — between owned and rented). Without having any land registry figures at hand here, we can assume that some of these owners did in fact not own the land prior to the war. High inflation and tax policies by the Allies forced landowners to sell some of their holdings at relatively low prices, often to long-term tenants. The immediate postwar reconstruction of Tokyo was therefore owner-driven and actually increased homeownership levels.
Another factor could conceivably be that 1949 Tokyo did still trail its prewar population peak by more than one million inhabitants. It is more likely for you not to have returned to Tokyo by 1949 in case of you being a renter as opposed to an owner.
However, why did landownership then decrease at the national level? After all, the dynamics described above should hold for Japan as a whole. The housing stock was not only decimated in Tokyo but across most other big cities and Allied reforms should have impacted other cities as much as they did Tokyo. I’ll keep this question open as I go along and will return here if I find an answer. I would also like to find some sources in the SCAP archives that highlight the impact of the land and tax reforms on homeownership in Tokyo.
Let’s come back to spatial housing inequalities. I look at variations in living space, i.e. how much difference there was between average space per capita across the 23 wards. As usual, the most important variable in determining living space was whether the person rented or owned the apartment / house they were living in. In 1965, the year for which we have data on this, the average tatami mats of living space per person in owned accommodation was 5 mats, in rented only 3.
In contrast, it was not overly important where one would live. While richer (at that time, more distant is probably the better word) wards had more space per capita the differences were not too big, to the tune of 13% standard deviation over average. In 1965, the next year for which this data is readily available, average space per capita is almost 50% up compared to 1949, but the variability is still only 13% standard deviation over average. This tells us that the substantial increase in living space per capita took place equitably across the 23 wards during this period of massive economic and urban growth and amid falling homeownership. Granted, the average Tokyoite in 1965 only had 7 square meters of living space allotted to him/her, but this was up from only 4.5 in 1949!
From 1949 to 1965, homeownership (as calculated from my reports, not 100% in line with the graph above) declines from roughly 50% to roughly 40%. The variability across the wards is a little bigger than the variability in living space per capita, but not by much. Standard deviation over average is 16% in both 1949 and 1965. This means that the urban growth of Tokyo did not meaningfully change the ward-wise distribution of homeowners. There is also only very little positive correlation between income per capita and homeownership in the wards.
