What follows is the first post in a series on manifestations of inequality in postwar Tokyo. In these, I plan to cover living conditions and income inequalities across the different wards, at different points in time. Before going into the data that I collected over the past couple of days (and continue to collect), however, a few general words on inequality in Japan.

Income inequality trends, as per Iyoda Mitsuhiko (1991)
Japan used to be conceptualized rather frequently as a relatively equal, even classless society. When 90% of the population consider themselves as middle class (ergo: the “middle mass”), there is bound to be more social cohesion, so the argument went. (I say “went” because I don’t think there are many out there still holding on to the Japanese “middle mass”.)
More tangibly perhaps, a relatively equitable distribution of income and wealth is often thought of as one of the foundations of Japan’s postwar miracle. Capital formation, consumption and fiscal policy are three areas in which one can intuitively gauge the positive impact of a more equal distribution of income.
Japan’s postwar equity was by no means inherited. To the contrary, Minami (1998), among others, shows that prewar Japan was much more unequal than the postwar period. In Gini terms, one 1937 estimate is 0.547 (which is very high). For 1956, Wada estimates Japan’s Gini to have been 0.313, representing a remarkable equalization of incomes in the space of less than 20 years.
And income inequalities further declined from here, as several economists have shown (see Iyoda’s figures in the graph above), albeit a little more slowly and gradually. Key drivers of this trend were increasing wage equality and improved access to education. (It is not quite clear to me how taxation contributed to this trend given that the effective tax rate declined in almost every year on record.)
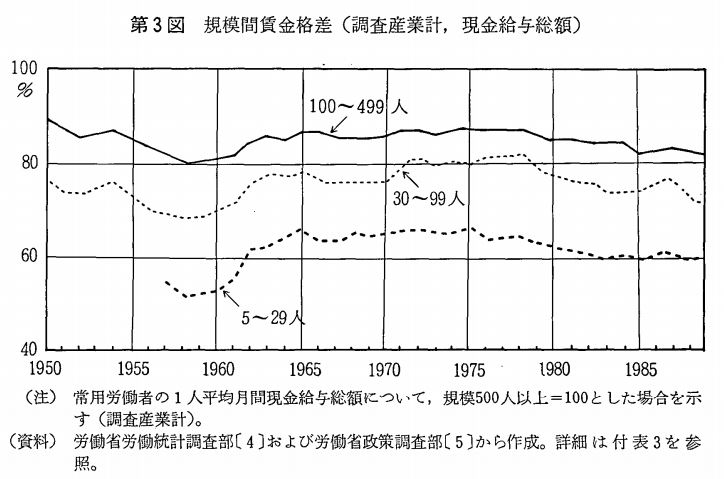
This graph (also taken from Iyoda) provides much of the story for wage equality in the postwar period. It shows how the wages of workers in small and medium-sized enterprises (5-29 workers), plotted here as a proportion of wages paid in 500-plus worker firms, increased faster than those in the other categories from the mid-50s onwards. This has important implications for Tokyo, where the share of small enterprises was a little higher than that for Japan as a whole.
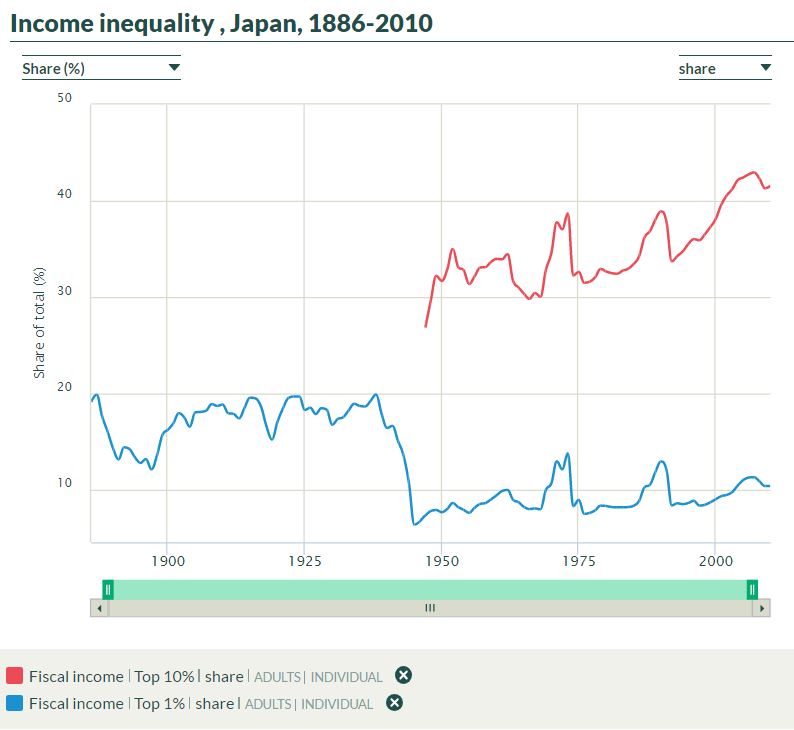
For another way to conceptualize inequality in Japan, consider this screen grab from the World Top Income Database, which Thomas Piketty uses in his Capital in the 21st Century.
We see the radical compression of the top 1%’s share in total income due to the war. This was due to the destruction of physical assets, outright expropriation as well as land, tax and other reforms enacted during the early Occupation period. The trends are well described in Tachibanaki’s 2005 standard work Confronting Income Inequality in Japan.
The top 1%’s share stabilizes at a lower level and slowly begins its increase a few years after the war. More tellingly, we have postwar data available for income share of the top 10%. From inception of the data series onward, we see this group’s share of total income increase steadily. This is in contrast to social democracies in Europe, e.g. France, which saw the top 10% share decline (roughly) until 1980.
What is important until here is that the lion’s share of the postwar equality had its roots in the early postwar reforms. In my period of observation, i.e. the late 1940s until 1970, there was still some equalization of incomes taking place, primarily driven by wages. At the same time, the share of the top 1% and especially top 10% income earners increased.
