The treasure trove that is the 1961 TMG urban planning atlas has two fascinating maps on the distribution of factories and their growth. They show that the traditional areas of industrial activity are also attracting most of the growth in new factories.
This post comes in addition to the two I already published on the blog a few days ago; the first one being on population growth and density and the second one on land use and zoning. Today I complement the information from the maps with statistics drawn from the Tokyo Statistical Yearbook.
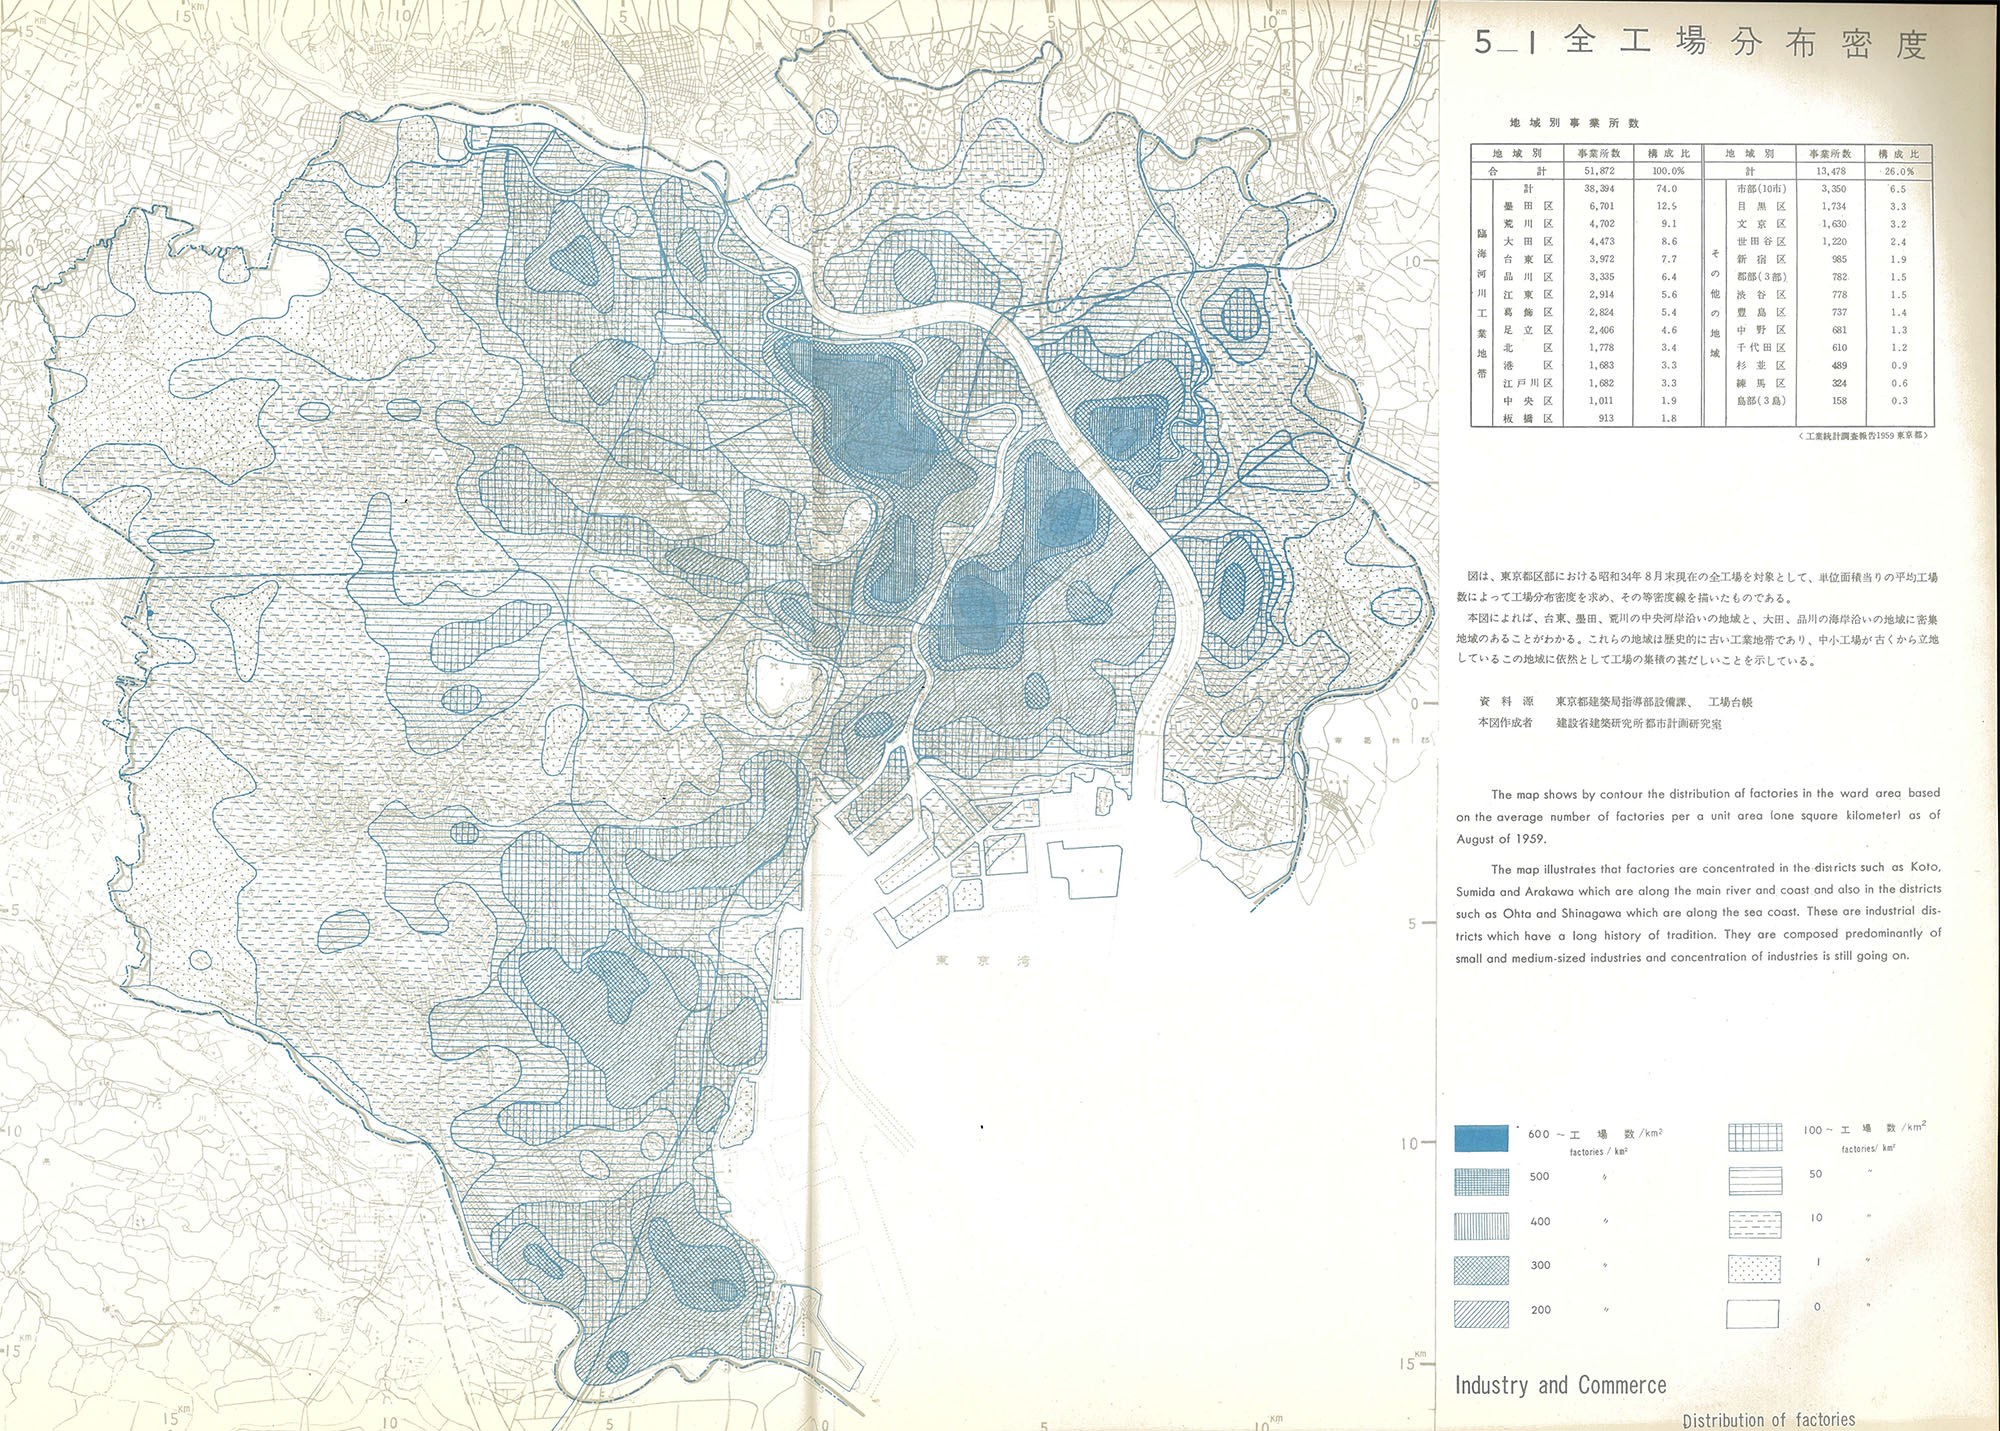
The first map (above, click for higher resolution) shows the distribution of factories in the 23 wards of Tokyo as of August 1959. There is a visible concentration of factories in the traditionally industrial parts of the city along the Arakawa river and the coast.
Certain parts of Arakawa, Sumida and Koto wards have a factory density of more than 600 per sqkm. This heavy concentration of industry has firm roots in the prewar era. Paul Waley has written beautifully on this here. I went on a walk through Sumida a few months ago.
A large proportion of these shitamachi factories consisted of small and medium sized enterprises. Small often meant very small, i.e. owner-operated workshops employing only 1-3 people, hardly conjuring up the image of a factory. More on this below.
Back to the map: I found the expansion of this dense factory area towards Katsushika ward on the eastern shore of the Arakawa river interesting. To be more precise, this is Tateishi and its surrounding area. I will hopefully go on a little walk there soon and learn more about the area.
Another part of Tokyo I did not have on my radar so much in connection with urban manufacturing is in Itabashi ward, with its epicenter near the fantastic Maenohara Onsen (from what I can gauge from the map). This area has traditionally focused on paper production, printing and leather processing (bag and shoemaking, etc.).
Towards the south of the city centre, we see the cluster around in Shinagawa and Meguro wards which I briefly mentioned in the previous post on land use and zoning, and where my friend’s parents are planning on rebuilding their house in a zone designated as “semi-industrial”.
Further south is Ota, the “other” quintessential industrial hub of Tokyo. I wrote a post about the Ota model a few months ago on this blog. The area’s factory density was lagging that of the more traditional shitamachi area, with Kamata having the highest concentration of factories in the ward.
Their average size was larger than of those in Sumida, however: Owner-operated factories employing 1-3 people accounted for 21% of all factories in 1959 (compared to 38% in Sumida), 67% employed between 4 and 49 people (59%), while factories with more than 50 employees accounted for 12% (4%) of all factories.
This fact, i.e. that factories down in Tokyo’s south were on average larger than those in the more traditional industrial hubs, also helps explain why in 1960 Ota “managed” to employ 62% of its workforce in manufacturing, as opposed to 58% in Sumida, despite there being a lower factory density.
Note that these values also mark the peak of manufacturing employment in Tokyo. They would begin to go down from here. In 1969, Ota’s manufacturing share of total employment had decreased to 53%, that of Sumida to 52%.
These figures were still exceptionally high. To provide some context from today’s developing world: In 2001, Mumbai’s manufacturing share of total employment was 26% (down from a 40% peak in 1971) while that of urban China was 20% in 2014.
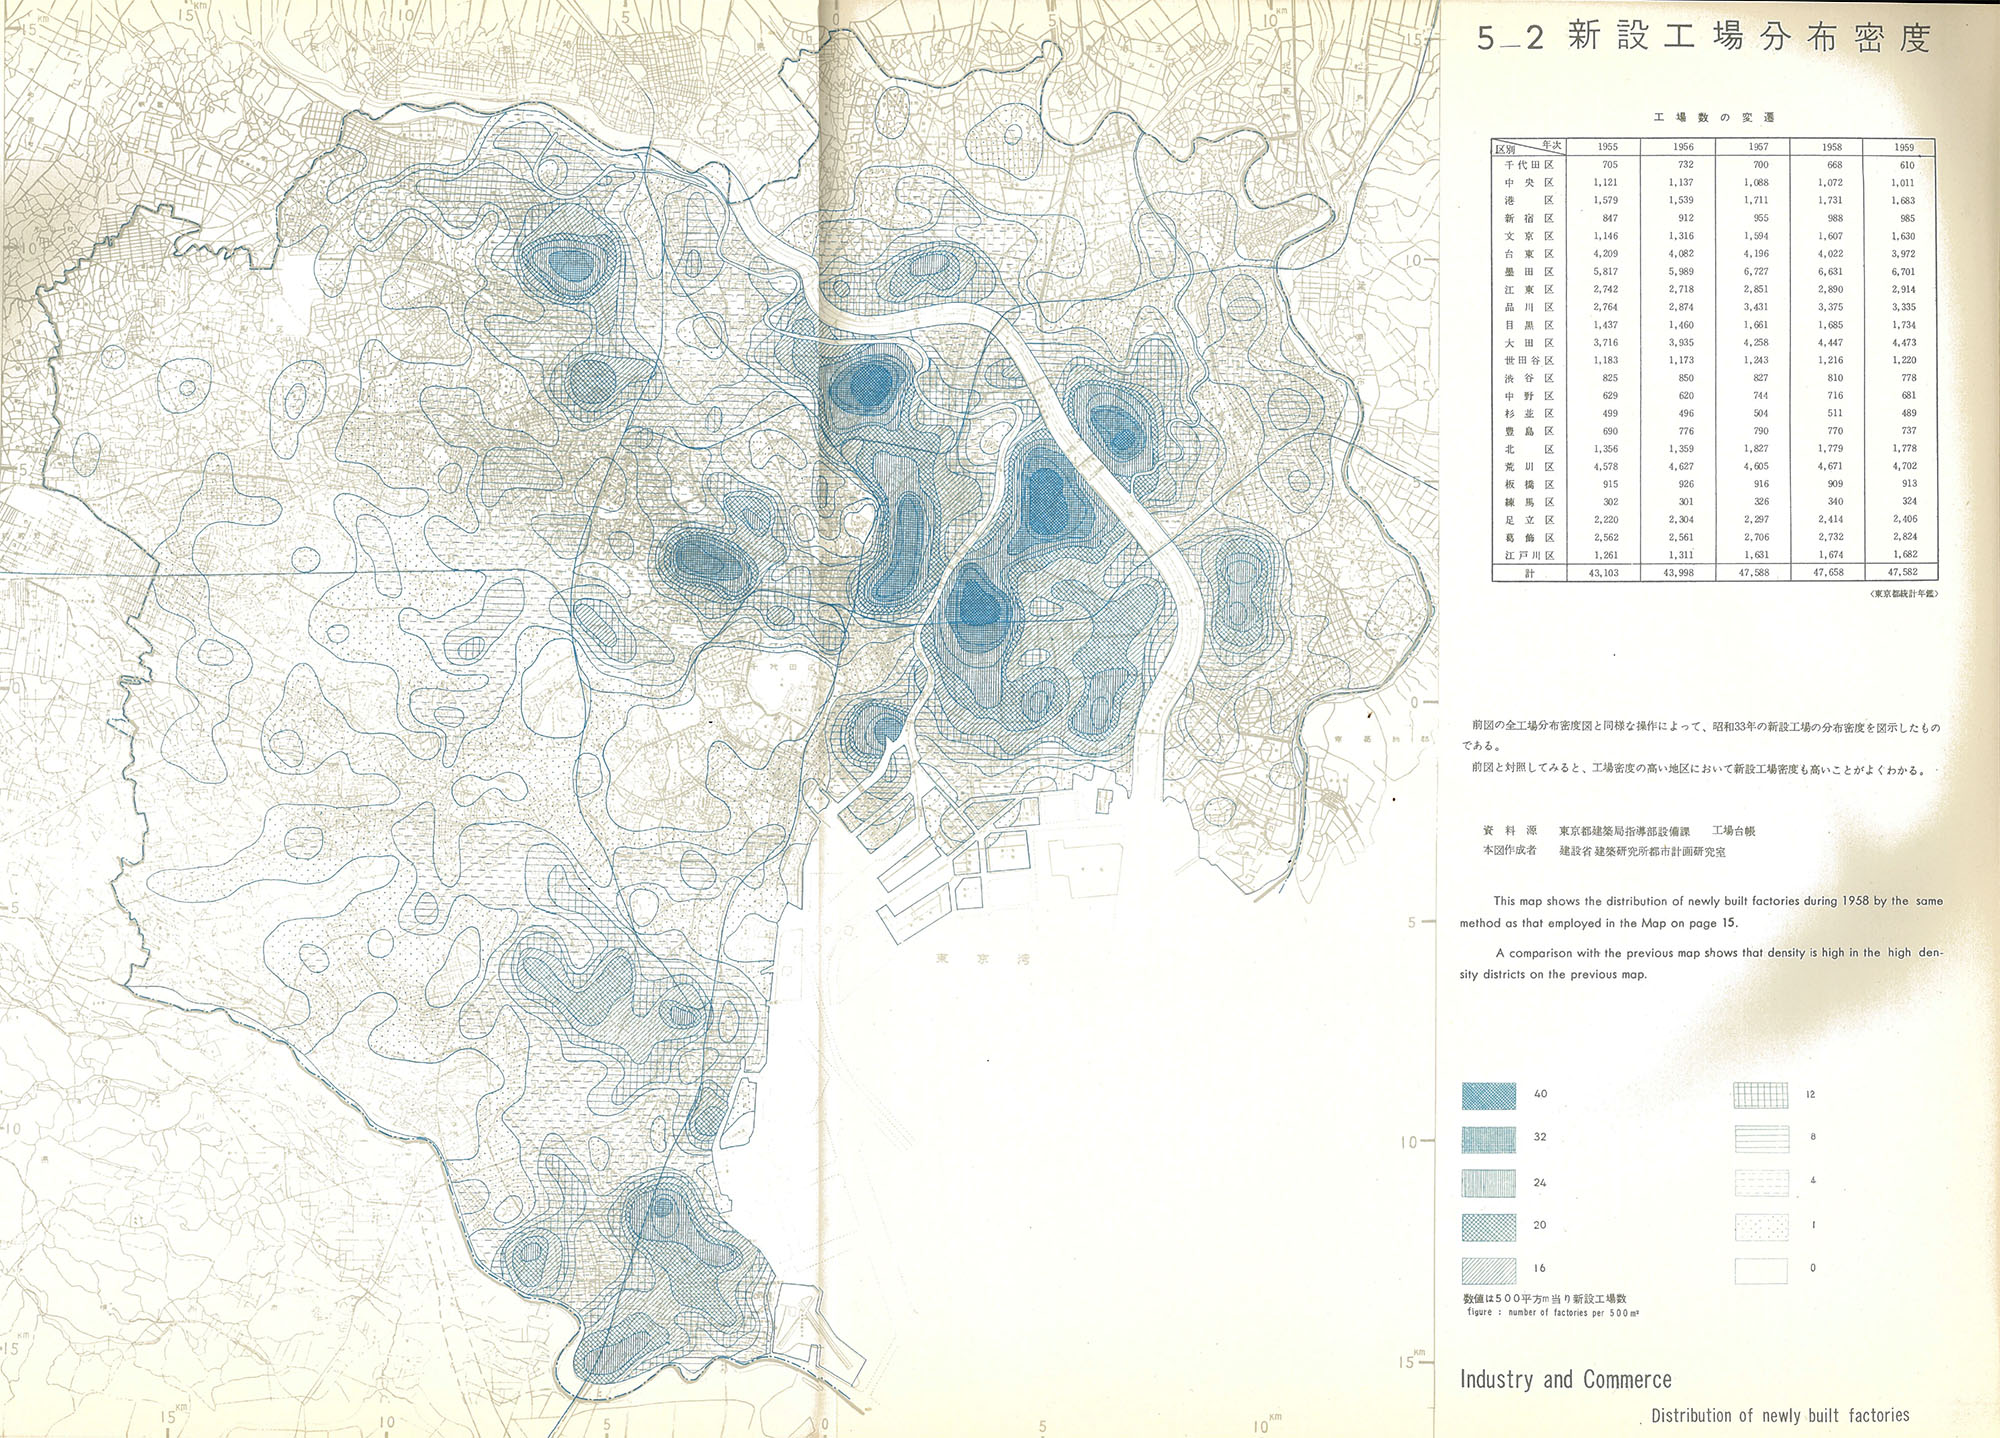
The second map shows the amount of new factories per sqkm opened over the course of one year (1958). There are not many surprises evident here, i.e. most factories opened where there were already a lot of them to begin with.
It is also not clear whether these factory openings contributed to the density of factories as we do not know about factory closures that occurred during the same time.
From the Tokyo Statistical Yearbook we can see that both Ota’s and Sumida’s peak in the total number of factories was reached a little after the maps were produced, in 1963, with 7,556 and 9,255 factories respectively. At 60 sqkm, Ota is about four times larger than Sumida.
What does all this tell us? High density and the prevalence of small owner-occupied workshops is one important factor we need to consider when recounting Tokyo’s prewar and early postwar economic history.
However, given that Ota proved to be Tokyo’s most successful industrial ward, most notably from the 1960s onwards, we also need to account for the area’s less dense factory distribution and larger average factory size.
