My supervisor and I dug up a fascinating book in the library a few weeks ago. It is an early 1960s Tokyo Metropolitan Government publication that introduces the main urban planning issues Tokyo was facing ahead of the Olympics via thematic maps. Herewith its take take on population growth and density.
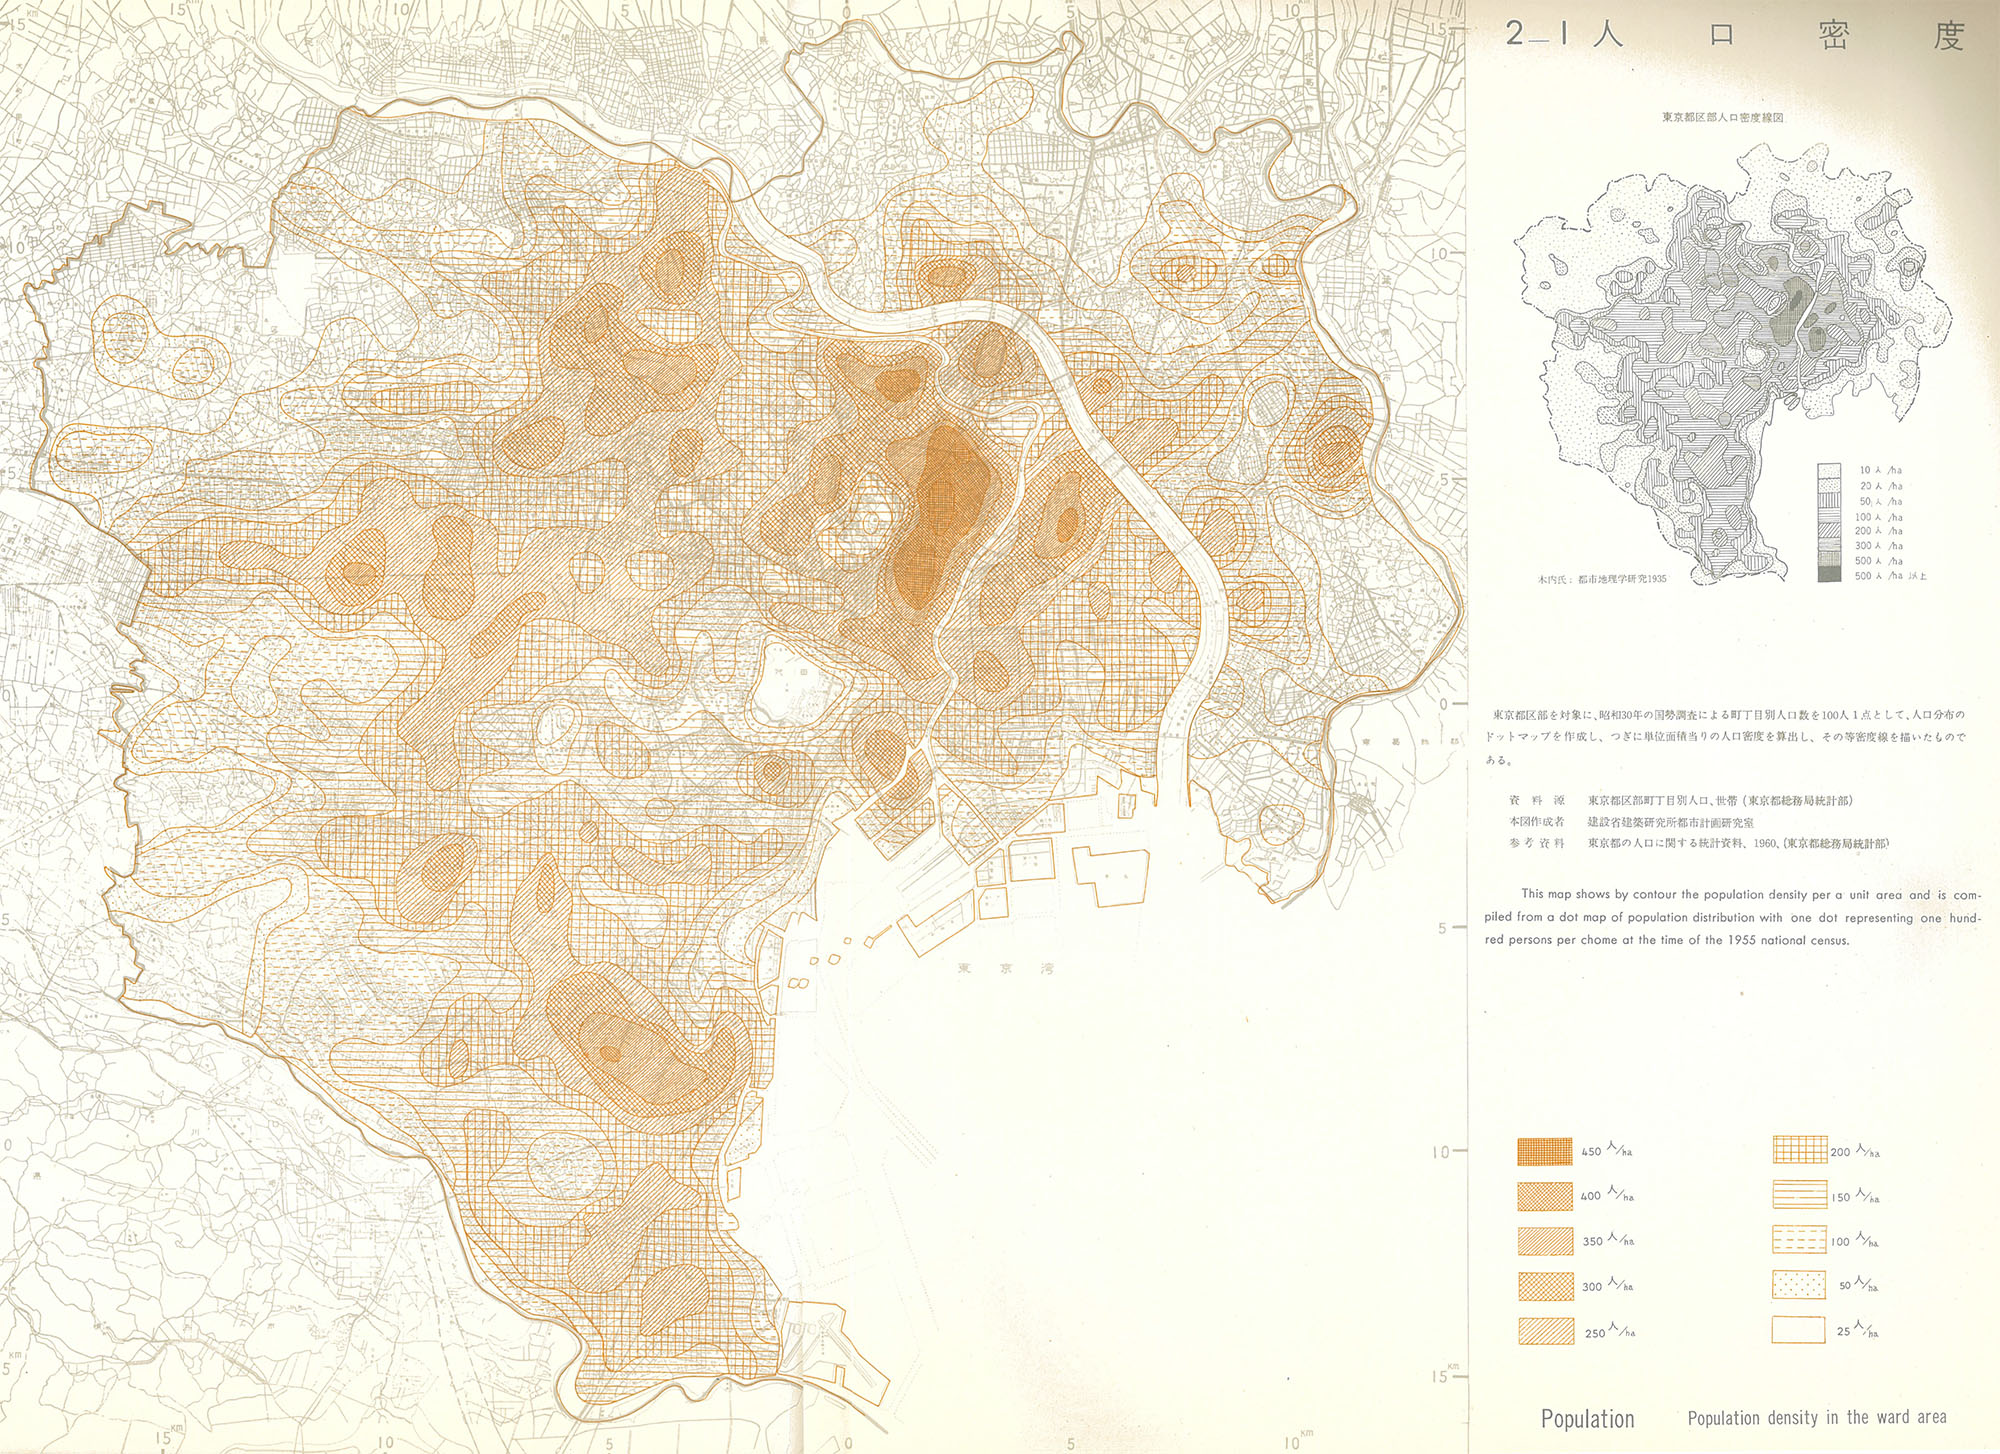
The first map (above, click for higher resolution) shows population density per chome (neighborhood) as of 1955. We see that the traditional shitamachi area in Tokyo’s centre-east is still the most densely-populated part of the city, with certain sections reaching a density of more than 45,000 people / sqkm.
The black-and-white map to the top right shows the population density before the war in 1935. The shimatachi area was only slightly more densely populated than in 1955, with a few sections accommodating more than 50,000 people / sqkm.
This continuity in density pre-war and post-war is striking and I wonder whether the same can be said for the 1923 Great Kanto Earthquake. Just like the 1945 firebombing it saw the almost complete annihilation of the shitamachi area.
An important difference was the land readjustment subsequent to the 1923 earthquake, which had no real postwar equivalent, and which saw some de-densification via the widening of streets and enlargement of public space in this part of the city. I will keep my eyes open for density statistics pre-1923.
I have meanwhile found population density maps digitized by the University of Tokyo here. They show almost no change in density patterns in the inner-city areas between 1920 and 1930 (although their maximum density is 30,000+ inhabitants / sqkm unfortunately). The contrast between 1920 and 1960 is very interesting inasmuch as we see some de-densification of the shitamachi area having taken place. [More maps in this new post.]
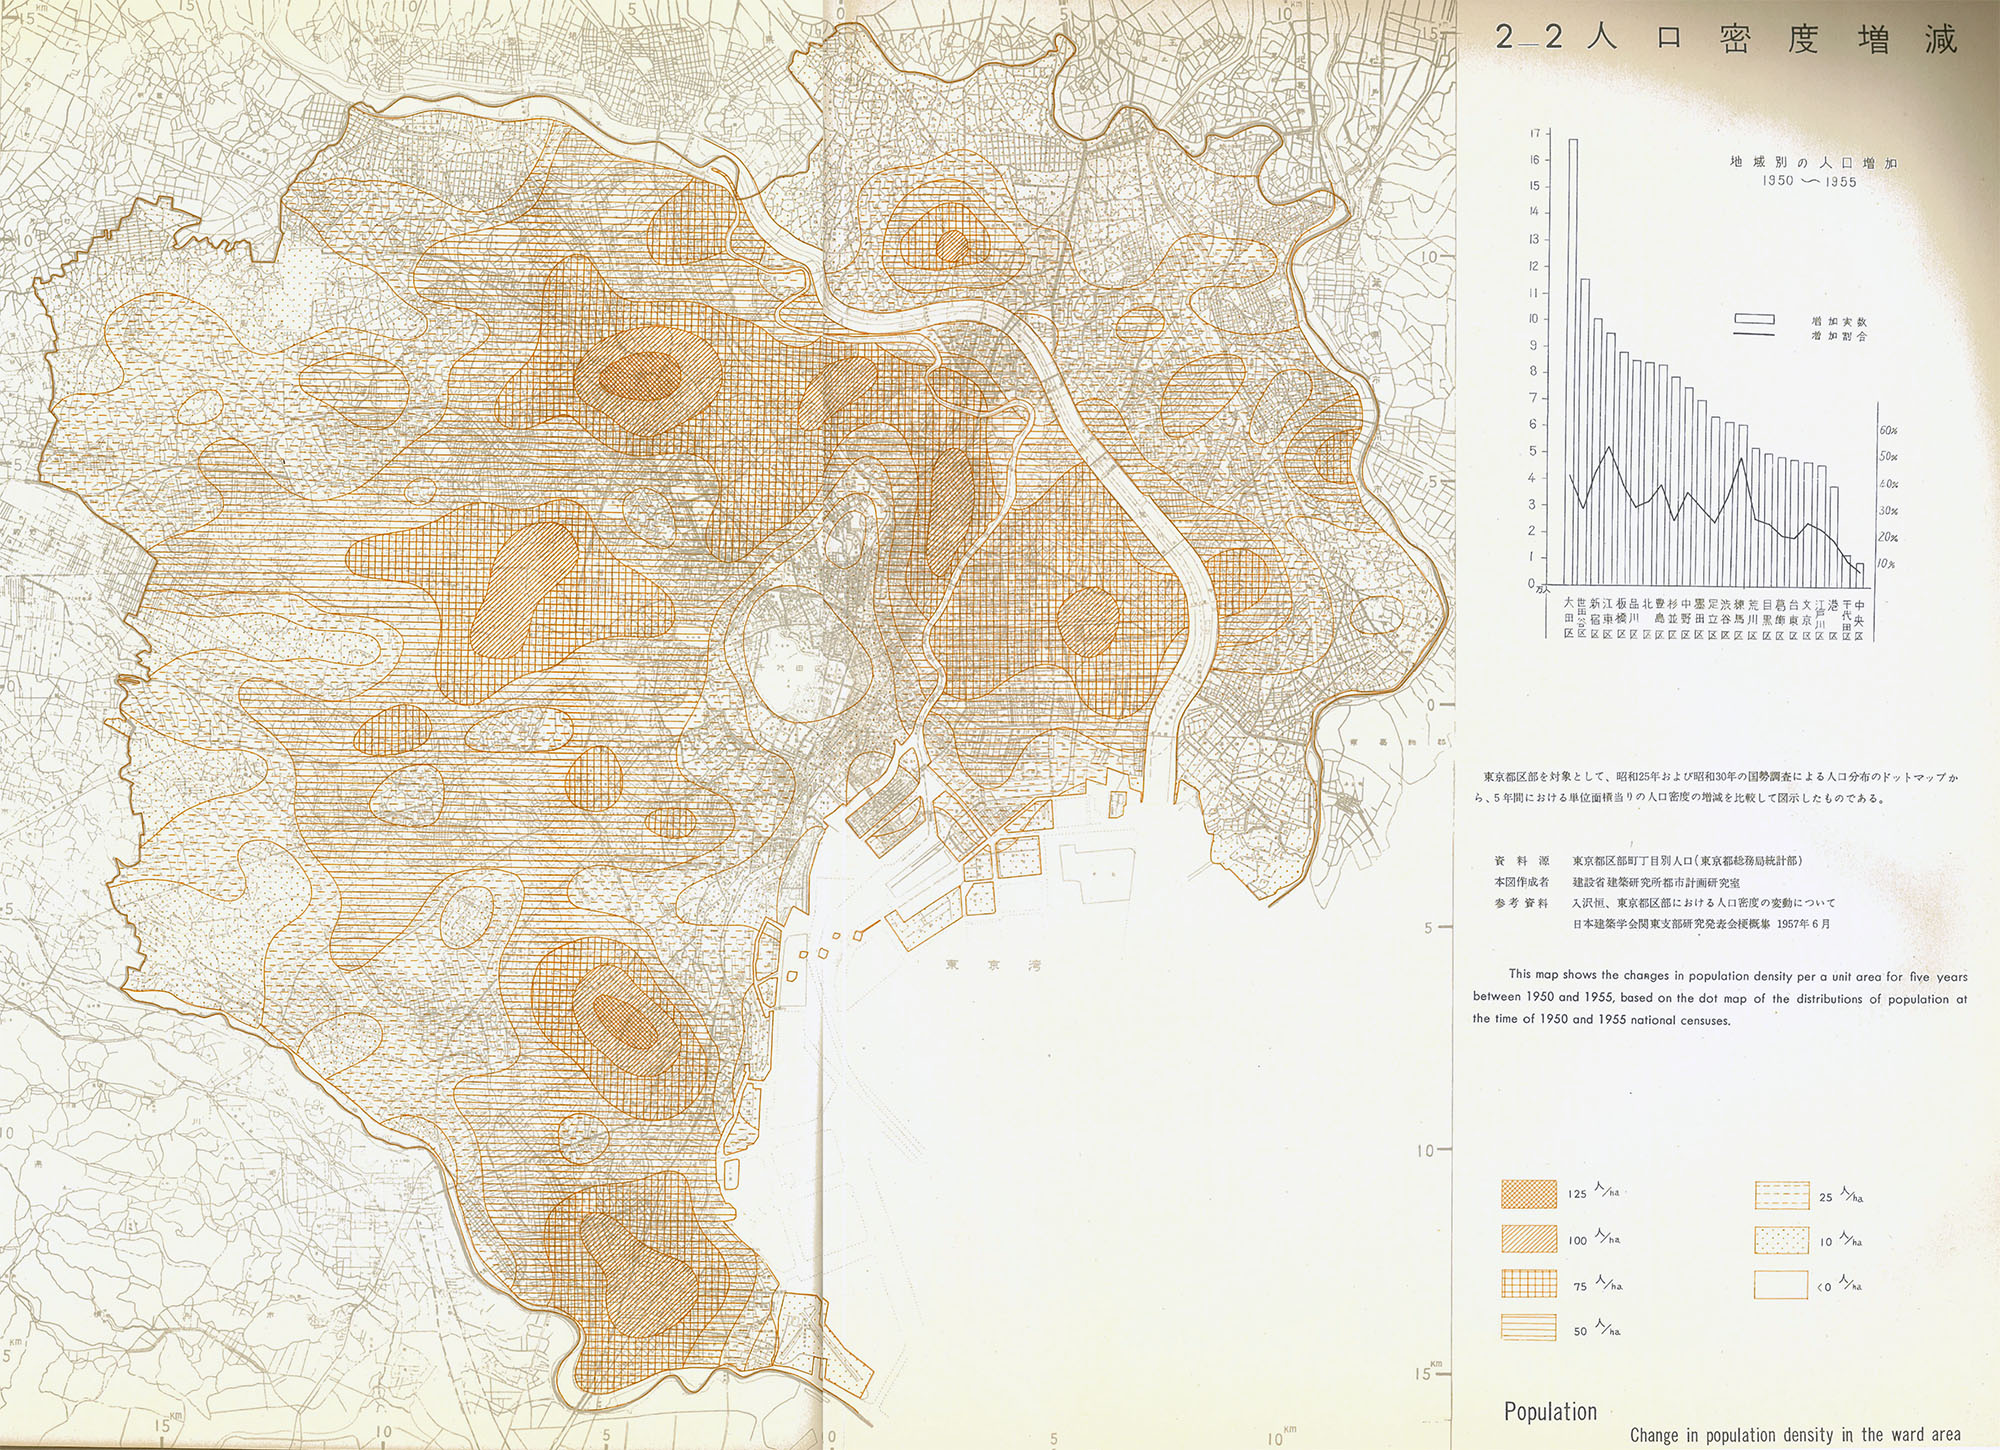
The second map provides some details as to where the rapid population growth that took place between 1950 and 1955 concentrated: First off, by ward, the chart at the top right shows that Ota experienced by far the largest growth in its absolute population, while Koto and Nerima saw the highest relative growth.
The map confirms growth in density for Ota (100 more people per hectare concentrically from Kamata, for example), Koto and Nerima. However, the areas with the highest “densification” were in fact Shinagawa and Ikebukuro, two postwar boomtowns on the Yamanote line. They each saw 125 more people per hectare settle here during this period.
How do these density figures compare to some of today’s cities?
Let’s start with the extreme on one side: While precise figures are not known, Dharavi’s density could be as high as 290,000 people / sqkm, about six times as many people crammed into the same space than in Tokyo’s most densely populated postwar neighborhoods.
Dharavi’s typology is not unlike that of some of Tokyo’s “organic” neighborhoods, i.e. it is low-rise and mixed-use, and its street grid follows no planned layout. However, the space per capita is much smaller and streets are even narrower. When looking at these numbers, Charles Correa’s opinion that the Mumbai slum needs de-densification is perfectly understandable.
For an international city-wide comparison, this Wikipedia entry helps to get an overall feel. Mumbai is “only” on rank 27, with a population density of about 21,000 people per sqkm, a fraction of Dharavi’s.
At the top of the list is the City of Manila, which crams about 1.8 million inhabitants into 43 sqkm, making its density comparable to that of postwar shitamachi (41,500 people per sqkm). On third spot is Dhaka, whose density is about 28,000 per sqkm.
Tokyo does not feature on this top-40 list at all. Hence, if we look at the macro level, i.e. that of the city as a whole, we can see that Tokyo is not extremely dense, but has a relatively high density all throughout its 23 wards, which reaches about 15,000 people per sqkm.
What is striking is that with the exception of Chiyoda, the main business ward, the 23 special wards have a very equal population density varying between the extremes of 10,900 on the low side (Minato) and 23,000 (Toshima). This defies many other cities, whose density decreases markedly the further you get away from the central area, e.g. Paris’s twenty arrondissements.
This amazing map (whose source data I am looking for) classifies Tokyo’s densest areas today with accommodating more than 30,000 people per sqkm.
