I have decided to put some of my little research assignments (largely “self-assigned”, that is) onto the blog in order to share them more widely and get myself to be more disciplined in articulating my thoughts. This one below is about Japan’s infrastructure investments over the last 100+ years.

It comes from this JBIC paper here. There is much else to chew on in it, but for now, the most interesting bits from the graph above:
- It took until about 1960 for transportation sector investment to reach the pre-war peak of about 1.25% of GDP. It is perhaps a little surprising how long Japan was sustaining high (reconstruction) growth rates with such low figures. It also suggests that Japan was operating on pre-war infrastructure and rolling stock for a relatively long time.
- After 1960, and with Ikeda’s infrastructure-heavy income doubling plan, transportation sector investments increased rapidly, reaching 3.5% of GDP by 1980. GDP growth had already come down from its 1960s heights.
- Table 1 in the paper shows how this intuitively tallies with a much lower ICOR in the last period of observation in this particular research (1965-1975, ICOR = 5.4 compared to just 2.8 from 1954-1965) — i.e. much more investment was needed to generated one more unit of GDP as time went by.
- Interestingly, it took the entire observation period (i.e. until about 1980) for electricity sector investments to reach their pre-war peak of about 1.5% of GDP. Before the war, when Japan was in its early stages of industrial development, electricity demand growth was far in excess of GDP growth, as shown in Figure 7 of the paper. After the war, electricity demand grew much more in tandem with GDP growth. This illustrates how despite all the wartime destruction, Japan enjoyed a head start in its development and benefited from a substantial surviving capital stock.
The period under observation in the graph is also one of unprecedented urbanisation. Here is the share of Japan’s population living in cities as well as Tokyo’s total population from the 1920s until 1970:
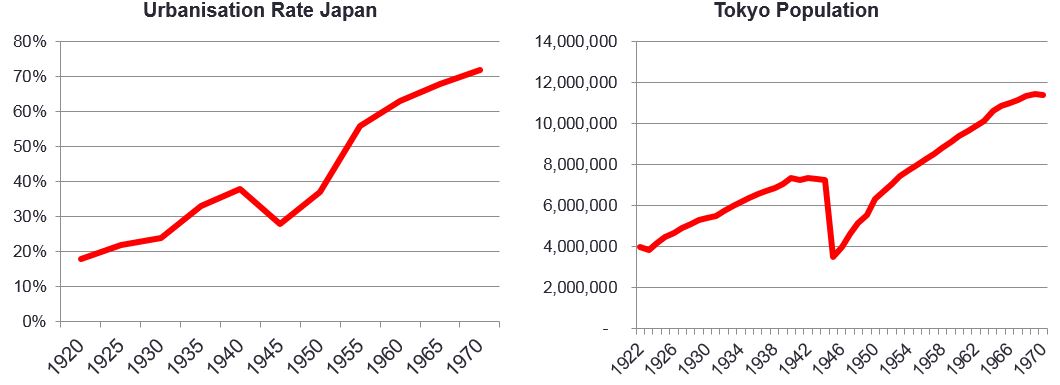
Hence much of the infrastructure investment took place in the growing cities. Most of it came in the form of elevated highways, new subway lines and other big-ticket investments. My Tumblr features a lot of the imagery for this, e.g. here.
From a brief look at the data I have at hand, I would find it rather difficult to rebuild above statistics and ensure that I capture all infrastructure spending of the government. The postwar model of Japan’s growth was “notorious” for channelling much investment spending off-budget, primarily via the Fiscal Investment and Loan Program (FILP).
I also wonder whether the above statistics include the relatively small yet important share which went into the less visible but equally important “neighbourhood infrastructure” (think sewerage, smaller roads, the often haphazard telephone and electricity lines and so on).
They were largely built in situ (which, as Matias from Urbanology thinks, brings with it many advantages) and thus preserved most neighbourhood’s typology, allowing for incremental upgrading of entire city blocks.
In order to find out about this, one can look at municipal finances, as many of these local investments fell under the remit of, say in Tokyo’s case, the 23 special wards. There were also private companies which invested in infrastructure prior to them providing municipal services.
If anyone has any insights on that, please share! I will also put any research findings in this direction up here.
